Problem: Measuring progress to facilitate risk management.
Many a risk-log has ended it's life without any real value being added, due to lack of implementation and follow-up. The reason is, in my experience that the project fails to use test metrics for follow-up and governance.
Solution: Baseline the risk register on regular bases and compare metrics.
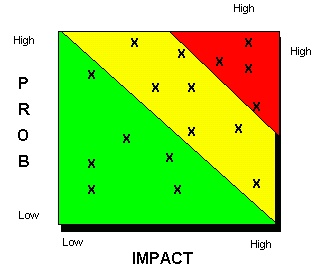
In order to baseline the risk log you would require a document containing the risks and some metrics. There are many ways of working with risks, but most common is the probability and consequence. This allows the project to plot the risks in a risk matrix, detailing the priority that the risks should have when working with mitigation. The matrix might look like this:
From here on the fun starts! Based on the risk mitigation activities that you implement you should see changes in the risk matrix. E.g. if your strategy is to address high probability risks first, you should see a trend of risks moving downwards in the matrix, and here is how it works:
On a monthly basis, you compare the risk matrix to last month, and you look for the following:
- No change = Your risk management process is not kicking in, as the log is not changing!
- Fewer risks = Your risk management is either mitigating those risks, or they are turning into issues.
- More risks = Project is getting wiser, risks are identified – Food for thought and planning / mitigation.
- Risks are migrating South & West = You are mitigating the probability and Impact of the risks.
- Risks are migrating North & East = Your efforts are not mitigating the probability and Impact of the risks.
By doing this you will raise awareness on the risk management exercise, and force stakeholders to engage in a dialogue on risk within the project.
Another and even simpler way of baselining is to do a count of the number of risks and their status (assuming that you operate with one). You might have a list like this:
Potential: 14
Actual: 25
Averted: 12
Irrelevant: 3
Total: 54
Comparing the numbers on a regular basis will tell you if your risk management process is moving the risks in the right direction. You can even do a little trend-graph to keep things manager-friendly.
Finally, the use of tools will make it much easier for you in the long run – I’m not going to promote any tools, as I have no preference. One word of advice is to use Dr. Google and look for a risk management template for Excel, that should get you quite far for free. Look for a template draws the risk matrix for you.
Happy testing!
/Nicolai
No comments:
Post a Comment